
Yin Jianfeng殷剑峰
Source: 网易 2023-01-17
Yin Jianfeng is the Chief Economist for the China Zheshang Bank and a director of the China Chief Economist Forum, an organization of top economists in the Chinese finance industry. Here he shows that a high proportion of government sector income — from revenue from state-owned enterprises and from taxes — coexists with a low rate of transfer to China’s people broadly speaking. The money the government collects, in other words, is transferred within the state more and to the people less. This can even be said to be the primary reason for the Chinese people’s low consumption rate. In fact, officials statistic underestimate the income of the government sector. If we take into account the state-owned land transfer fee that is included as state-owned enterprise (SOE) income in statistics but is at bottom government income, for the period between 2012 and 2020 the proportion of government sector income in national income is actually even higher.
Since the proportion of national income accruing to the government in China far exceeds that in other countries, where does all this money go? Answering this question requires analyzing China’s fiscal-expenditure data, which is a labor-intensive task because the relevant statistics in China are different from those of other countries.
1. Opening the black box of Chinese government expenditure
In any country, government expenditure includes both what is spent on government consumption — direct provision of services to the public such as education or court services and policing — and government investment — purchase or construction of assets that facilitate government services, e.g., construction of schools or court buildings or producing military weaponry.
Among these two, government consumption is a black box that for China has never been opened. According to the definitions governing China’s national accounts, government consumption is “the consumption expenditure of public services provided by government departments for the whole society plus the net expenditure on goods and services provided to households free of charge or at a lower price.” Obviously, it is impossible to know in much detail what government consumption is, and the relevant statistics concerning the specific content of such consumption have never been published.
In the World Bank’s cross-country data on fiscal expenditure, government consumption is primarily divided into: compensation of employees, expenditures on goods and services, and subsidies and other transfers. However, in the World Bank’s dataset, there are no data on these specific categories. (There are overall data on the revenue side, for fiscal revenue and government debt).
Using the statistical standards of the World Bank, to count these elements this paper breaks down government consumption based on the flow-of-funds table from China’s National Bureau of Statistics, and compares it with GDP data released by the Ministry of Finance. The former do separate actual government capital formation (new factories constructed by state-owned enterprises, for example) and transfers from one SOE to another. For readability, the specific technical details are omitted here. The other component of fiscal expenditure, government investment, is relatively transparent. Government investment includes two parts: first, government capital formation, investment directly engaged in by the government, and government capital transfer, government transfer of funds to state-owned enterprises, and indirect investment through these enterprises.
Comparing total government expenditure as counted in this paper with the figure announced by the Ministry of Finance, we can find that the two are almost equal. For example, the financial expenditure announced by the Ministry of Finance in 2020 is 24.57 trillion yuan, and the government expenditure calculated in this article is 24.41 trillion yuan. Therefore, the calculation method used here should not be a problem.
According to the MoF data, from 2012 to 2020, government spending is primarily used for three purposes: government-employee compensation accounts for 34%, social-welfare assistance accounts for 32%, and investment (the sum of capital formation and capital transfer) accounts for 32%. Statistical error between the two figures thus only accounts for 2%.
So, is this allocation of funds typical for a country at China’s stage of development? Below we will compare the fiscal-expenditure structures in major developed and emerging developing economies to reveal the apparent problem in China’s finances.
2. Chinese government expenditure in comparison with other countries
China’s current fiscal system is still based on the framework established after revenue-sharing reforms of 1994, which reorganized the flow of funds between the central and local governments. Throughout the data period below, given its stage of development China’s overall fiscal structure should be a “growth fiscal system,” one more characteristic of a significantly market economy in a not yet fully developed country. Whereas government expenditures in developed economies are typically dominated by social-welfare and other transfer expenditures (what I call a “public-finance” approach to fiscal structure), in less developed countries we expect more government investment in infrastructure and other things to promote economic development.
As the economy develops and the market economy matures, the fiscal structure should eventually shift to the public-finance approach. However, a comparison of 15 developed and emerging developing countries — China, France, Germany, Greece, India, Indonesia, Italy, Japan, Mexico, the Republic of Korea, Russia, South Africa, Spain, the United Kingdom and the United States — shows that this shift has largely failed to take place, and even the “helping-hand” notion — the idea that fiscal transfers should provide people with the basics of life — has become a cover for other things.
Comparing government expenditures across the 15 countries, China’s fiscal system has particularly shown three characteristics in recent years.
A. “Stingy fiscal policy”
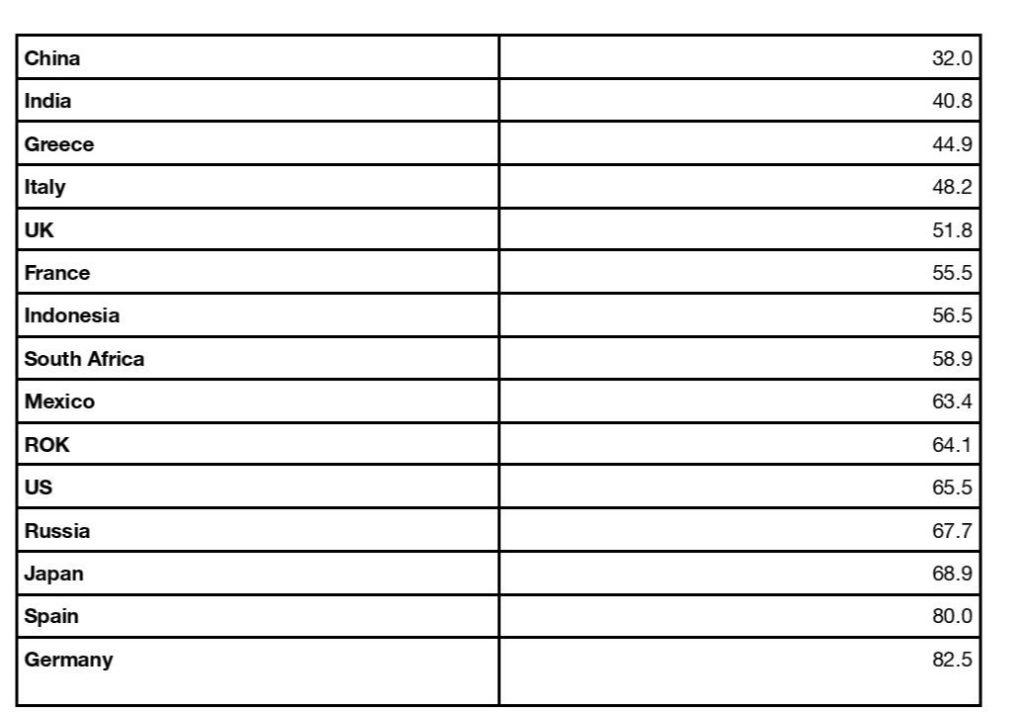
Table 1 — Average social-welfare expenditures as a share of government spending, 2012-2020
Table 1 presents one of several comparisons of China with 14 other countries. The first thing learned from this cross-country comparison is that the proportion of social welfare expenditure in China’s fiscal budget is very low. From 2012 to 2020, China’s welfare expenditure accounted for only 32% of fiscal expenditure, ranking lowest among all 15 countries. China’s proportion of welfare expenditure is lower than that of developed countries, which reflects the differences in the role of government spending at different stages of development. This is understandable, but it is also lower than that of all the BRICS countries, notably India, which is much poorer than China. It is awkward to have to point this out, but previous reports have asserted out that the main reason for the low consumption rate of Chinese residents is that the share of personal income in national income is low, but this is directly related to the fact that residents receive less social-welfare income.
B. “Investment fiscal policy”
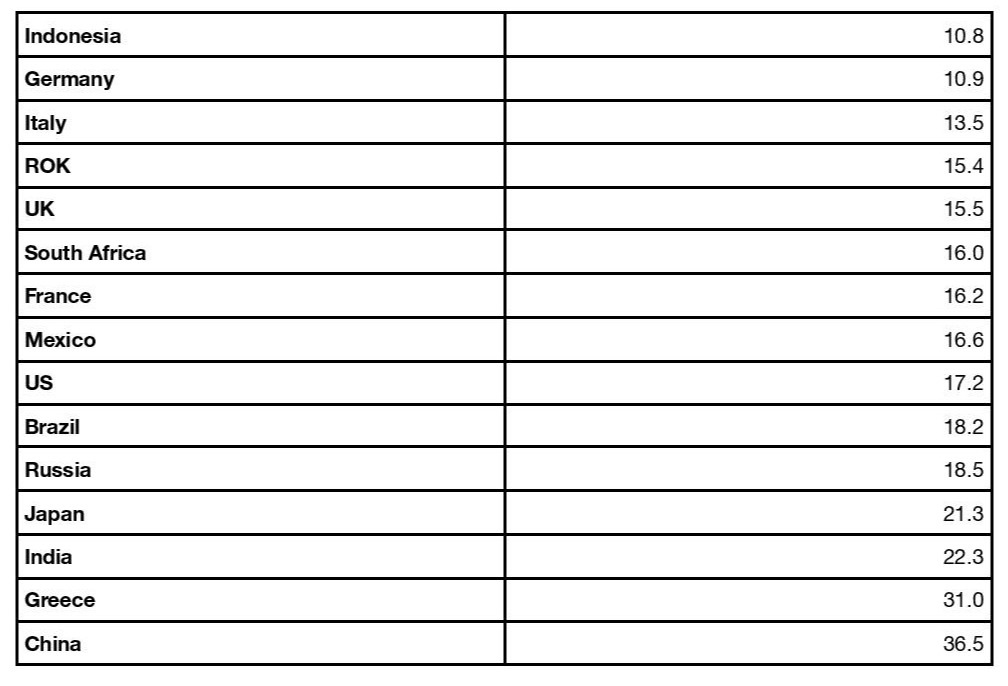
Table 2 — Average percentage of government investment in total investment, 2012-2019
The second thing we learn, in Table 2, is that the proportion of China’s fiscal expenditures going to investment is very high. As for the share of all investment public and private that was on average public during the eight years before the COVID-19 epidemic, China was again an outlier: its government investment accounted for 36.5% of all investment, followed by Greece’s 31%, Japan and India’s 20%, and then the remaining 11 countries below 20%. Therefore, the proportion of Chinese government investment is not only higher than that of developed countries, but also higher than that of countries with similar development stages or even lower development levels than ours. Previous reports have pointed out that given China’s GDP, its investment rate is much higher than that of other countries, and this development model is unsustainable. And here we see that behind the high total investment rate is excessive government investment.
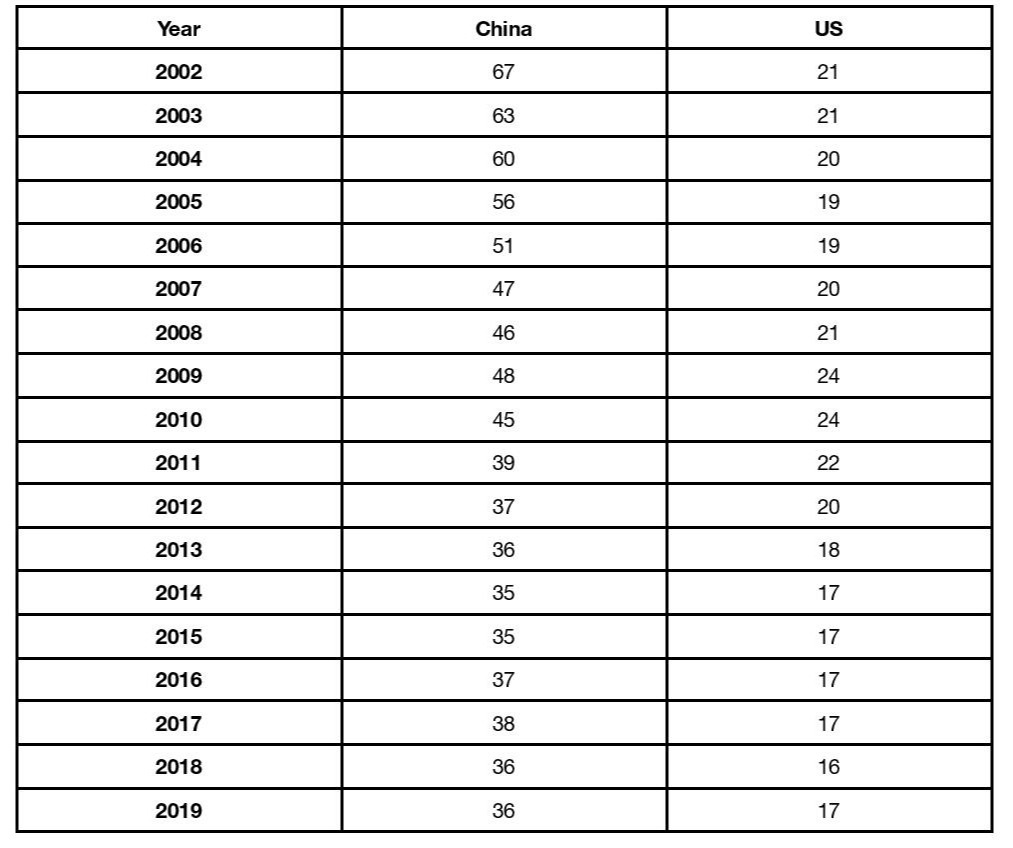
Table 3 — Percentage of total investment that is government investment in the US and China, 2002-2019
Looking at time-series data of the proportion of total Chinese investment that is government investment from 2002 to 2012, and discounting the anomalous “four trillion yuan” figure in 2009, which temporarily increased the proportion of government investment, the overall trend was that the growth rate of private-sector investment was much faster than that of government investment. Thus, the proportion of government investment continued to decline. Since 2012, the proportion of government investment has stabilized at around 37%. But compared with the United States during the same period, where the share of investment that is public has risen only somewhat after the 2008 financial crisis before declining again, the percentage of Chinese total investment that is government investment is still 20 percentage points higher.
C. Self-serving fiscal policy
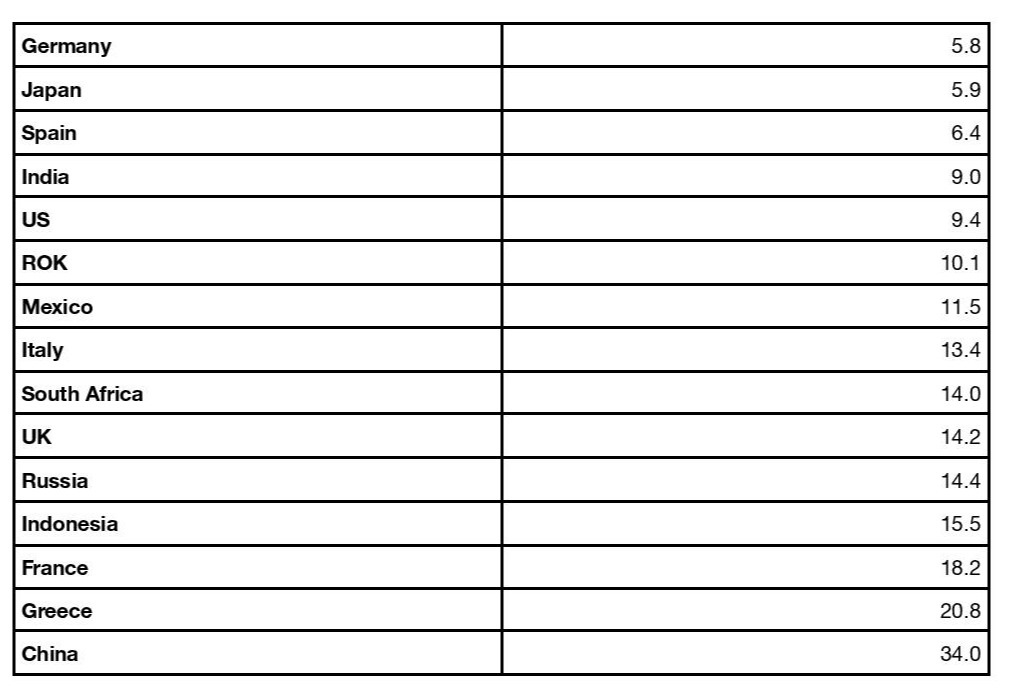
Table 4 — Average percentage of employee compensation as a share of government spending, 2012-2020
The third thing the cross-country comparison teaches us is that the proportion of personnel costs in China’s government expenditure is extremely high. From 2012 to 2020, the average proportion of employee compensation in China’s total fiscal expenditure is as high as 34%, which is 13 percentage points higher than that of Greece, the country that ranks second, and 2 to 5 times that of the other 13 countries. This feature is obviously contrary to any “helping hand” or social-welfare role of an effective government.
The three things we learn collectively from this cross-country comparison are that the characteristics of Chinese government expenditure are not merely caused by differences in stages of development, but by a serious deformity in fiscal functions. In particular, the high proportion of government investment and the extremely high proportion of personnel costs in fiscal expenditures show that in the past few years, the “helping hand” of the government not for people generally but for government employees has done too many things that should have been left to the market.
3. Government debt and deficit ratios
The three characteristics of China’s actual fiscal expenditures not only reflect dishonest fiscal policy, but are also directly related to the increasing pressure on government debt in recent years. The first source of funds for fiscal expenditure anywhere is revenue obtained by the government. If this revenue cannot cover expenditures, the government must issue new debt for almost all additional expenditures. According to Chinese government data, revenue as a share of expenditures was 73.9 percent in 2002, and had risen gradually to 100.9 percent by 2008. It was still at 95.3 percent in 2014, but then fell to 61.3 percent by 2020.
It can be seen that through 2014 the overall trend of fiscal expenditure was “to live within our means,” and the government’s disposable income supported the vast majority of government expenditures Even incorporating the unusual “four trillion yuan” year of 2009, the government’s disposable income supported 90% of fiscal expenditures. Therefore, many people attribute today’s government debt problem in China to the fallout from the “four trillion yuan” expenditure in 2009, which is not correct. In fact, the significant increase in the reliance of government expenditure on debt finance only occurred after 2015. In 2015, government expenditure supported by accrued revenue fell to less than 90%. At the same time, the proportion of new debt continued to rise.
In China tax revenues are no longer enough to cover expenditures, so government spending is increasingly dependent on debt. On the one hand, this spending is somewhat related to public needs, including genuine public investment, as always. But on the other hand, now a more important reason is swelling total compensation to public employees. Observing the proportion of government spending going to employee remuneration expenditure since 2002, from 2002 to 2012, except for a short-term increase during the “four-trillion yuan” anomaly in 2009, the overall trend had been of decline through 2014. But since 2015, the proportion of labor-compensation expenditure in the government’s discretionary expenditure has continued to rise, and by 2020 it exceeded 60%. In recent years, the wages of civil servants have not increased significantly (or may even have declined). Therefore, the increasing proportion of government spending going to employee compensation only indicate that more and more people are working for the government. This also explains why in recent years applying for civil-servant work has become more and more popular.
In addition to the debt pressure, another consequence of the annual fiscal deficit is that it has already exceeded the red line of the 3% of overall GDP. Observing the deficit rate calculated by the flow-of-funds table and that calculated by the Ministry of Finance, we can see that the trends of the two deficit percentages since 1992 are exactly the same. The only exception is that there is a modest difference when the economy is hit by a shock, when the former is greater. For example, from the Asian financial crisis in 1998 until 2003, the deficit rate calculated by the flow of funds statement first exceeded the 3% “red line” in 2015. Overall this problem has worsened steadily, in 2021 reaching almost 10% according to the flow-of-funds calculation. This deterioration in China’s fiscal position is apparent even in the more sanguine official pronouncements of China’s finance ministry, where the 3% line was first crossed in 2021. Therefore, even by the ministry!s own calculations it is increasingly difficult to stick to a deficit rate of 3% or less.
In sum, the results of the financial-system framework established by changes in the tax-sharing system among the national and regional governments in 1994 has reached the point where it needs to be completely reformed today. Not only has the function of finance been rendered dishonest, the transfer of administrative power and debt decision-making from local governments to the central government has generated the current local-government debt dilemma.